
To see other COVID posts, visit my Quarantine blog.
The world population is approximately 7.8 billion, while the population of the United States is 328 million, and the population of New Mexico is 2.2 million. Based on CDC data, the percentage of the world infected with COVID is 0.034%, while 0.263% of Americans are infected and 0.1% of New Mexican’s are infected. That’s a lot of data, but necessary for our analysis.
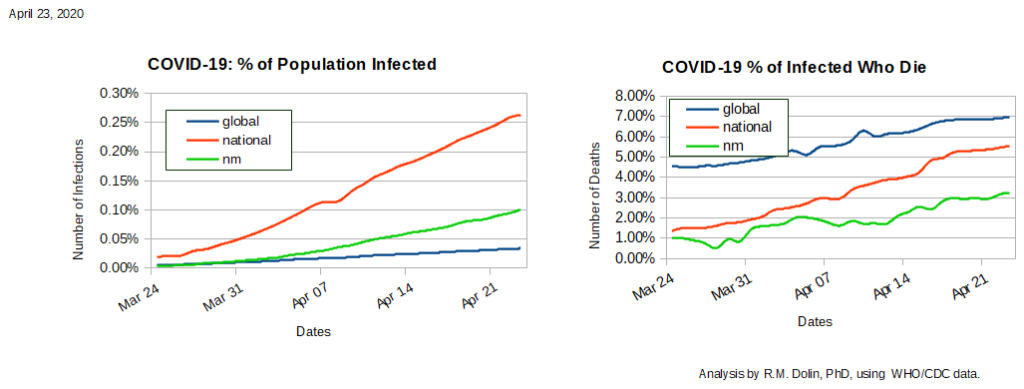
The “COVID-19 % of Population Infected” plot above shows both encouraging and concerning trends. On the plus side, the global rate of infection is essentially flat. Since March 24th, 2.2 million people have reported being infected, but the percent of the population infected has only increased 0.028%. Nationally the news is not so good. Since March 24th, 842,564 Americans have been infected and the percent of the population infected has increased 0.244%. What’s concerning is that the U. S. rate of infection is growing ten times faster than the rest of the world.
In our control state of New Mexico, the reported number of infections has grown 2,110, while the percent of the population infected has increased 0.095%. Keep in mind when looking at this chart that the percent of the population infected can only increase over time, which means the curves can never go down. We want to see the slopes lessening over time, like the global curve is behaving. It appears that both the U. S. and NM. remain in a rapid rate of increase, which is not good news and runs counter to claims that the “plateau” has been reached.
Another caveat in this data is that the percent of the U. S. population infected is disputed. While the CDC puts the number at 842,624, a recent Stanford University study puts the number at 50-80 times higher. Given the lack of success universities have had getting anything right during this crisis, I don’t put much stock in that study, particularly since it only included one California county, which makes it statistically irrelevant.
The “COVID-19 % of Infected Who Die” plot is alarmingly dire. The global rate of those infected who die continues upward. Since March 24th, 184,351 infected people have died, but more alarming is that the percent of infected people who died has jumped 2.42%. In March 4.54% of infected people died but today the rate is 6.96%. Nationally the news is just as bleak. Since March 24th, 45,976 Americans who were infected have died, while the percent of infected who died increased 4.20%. In March 1.35% of infected died but today the rate is 5.55%. While some of this delta is tied to the lag time between a reported infection and a subsequent death, the U. S. rate of death is growing faster than the rest of the world.
New Mexico is not fairing much better. The reported number of deaths in New Mexico has grown by 70 since March 24th. While this may not seem like much, the percent of the NM infected population who die has increased 2.21%. New Mexico’s current rate of 3.21% of those infected who die, is below both national and global rates but is increasing on a steady trajectory. If the current trend continues, in 15 days New Mexico will be where the nation is now in terms of the number of infected who eventually succumb to COVID.
Unlike the first chart, the percent of those infected who ultimately die can fluctuate, which means these curves can come down over time. The goal is to slow the rate of death to the point where the curves start to trend downward. That will be an indication that newer treatments are having an effect and that the virus is attenuating. A caveat in the national percentages is that the U.S. is the only country overcounting the number of COVID deaths, which in all likelihood is skewing the national rate upward.
According to the CDC, a normal flu season runs from October to as late as early May, which means we are almost at the end of a normal flu cycle. There is a growing concern that the Chinese-made Wuhan virus will not attenuate in warm weather as natural viruses do. This means the COVID pandemic could last deep into the year. Both charts above indicate the world and nation have probably not plateaued or are even approaching a point of slowing down.
During the 2017 flu season, the U. S. had 45 million people infected with flu (14%) and of those infected, over 80 thousand died (0.18%). So far this flu season, the CDC estimates that between 24 – 62 thousand Americans have died from the flu. While the issue of how flu versus COVID deaths are being counted or double counted is unresolved, the published number of COVID deaths are currently at 46,785, which COVID it in the center of the mostly unreported/un-sensationalized range for this year’s flu season.
With flu deaths in 2020 33% higher than COVID deaths, when there is a flu vaccine, why hasn’t state and federal government forced us into complete isolation to prevent the spread of deadly flu? And more important, why haven’t they done so years past? Other than political leverage, why is a COIVD death more valued than a flu death?
Continued Media Show Prep: I was listening to Rush Limbaugh the other day on a Chicago radio station and was pleased to hear that I am still being used as show prep. Rush was talking with a caller when he started to discuss Occum’s Razor using information from my April 13th post. Thanks Rush, check back as often as you like.

Ron, not disagreeing with your statement on the Stanford study, but I think it has statistical relevance from another point. It says that the CDC numbers of infected people are statistically irrelevant. This article (https://www.foxnews.com/us/new-york-antibody-study-early-results) says that 3M NYers have had the virus (consistent with the Stanford finding). These two articles seem to say that the DCD death rate numbers art also statistically irrelevant. Keep having fun!!
Dwight, I get your point, what I meant was that a sample size of one, is not statistically relevant. You would need to conduct this study in multiple counties to get a sufficient sample size to make conclusions. There are too many variables that could have skewed the survey, like the county was undercounted at the start, that between the first set of data and when they did their survey the virus moved into the county, etc. Thanks for your feedback, I always look forward to you keeping me on track.
Fantastic blog! Do you have any tips for aspiring writers? I’m planning to start my own website soon but I’m a little lost on everything. Would you recommend starting with a free platform like WordPress or go for a paid option? There are so many options out there that I’m completely confused .. Any ideas? Thank you!
I’m really enjoying the design and layout of your site. It’s a very easy on the eyes which makes it much more enjoyable for me to come here and visit more often. Did you hire out a designer to create your theme? Outstanding work!