Chapter 9 in the R.M. Dolin book, “Truth and Trust in Crisis,” 2021
CDC declares America’s part of the global COVID crisis ended in early June. While this is fantastic news it comes with a cautionary caveat, namely, deadly viruses can have second waves more virulent than the first. For example, the first wave of the 1917 Spanish Flu kills between three and five million people worldwide while the second wave kills upwards of thirty million.[1] When I was involved in local, state, and federal planning for the Avian Flu, we projected the first wave would kill several million Americans and the second wave would kill significantly more. Luckily that virus never achieves human-to-human transmission.
We began our COVID journey with a goal of determining if the virus was manmade and found it behaves like a naturally occurring virus, which doesn’t preclude it being engineered. This led us to develop an exponential-based model that has accurately predicted COVID deaths each of the past six months. Our model predicted that the epidemic would end on June 7th. Now that the first wave has abated, there is the issue of a second wave, for which there are three possible outcomes
- A second more deadly COVID wave is coming
- The virus is attenuating, and a second less deadly wave is coming, or
- The virus is fully attenuated, and subsequent waves will be benign.
If a second more deadly wave arrives, it’s further evidence COVID is a naturally occurring virus. If a second wave is less lethal, it suggests the virus was engineered because if you design a virus to either act as a weapon or to cull a targeted demographic, which seems the most likely reason anyone would engineer a deadly virus, you’d not want a second wave killing non-targeted demographics. I’m still perplexed about the absence of dead bats; they’d be everywhere if COVID were naturally occurring. Additionally, it appears our government is going to great lengths to obfuscate COVID death data and I can’t figure out their reason or rational. Given the quantitative and qualitative evidence presented thus far, I’m leaning toward COVID being manmade; either way, we’re about have our answer as the virus reveals its true nature.
It’s July and the nation’s embroiled in COVID chaos. Since declaring the epidemic over in June, CDC death data shows a continual decline tempting one to assume the country’s returned to normal, however, with the presidential election 95 days out the politics of COVID coupled with media induced hysteria portends the long, strange trip it’s been is only going to get more bizarre.
For the past five months, we’ve been tracking academic and FEMA model projections[2] used by the White House Coronavirus Task Force[3]. These models have consistently been outrageously wrong and yet, they’re still held in high regard because they support political and media narratives. Meanwhile, our first principles model, has been spot on each month.
Table 9.1. July Month-End COVID Model Performance.
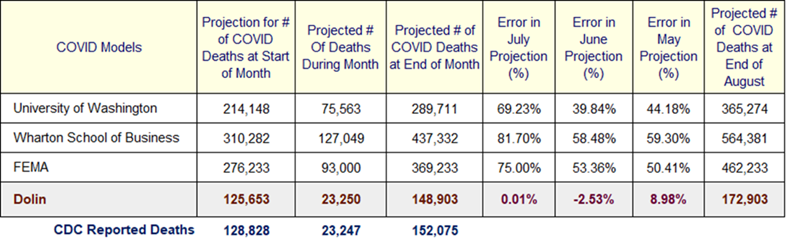
Table 9.1 summarizes the performance of our COVID model relative to the big three. The UW model has a July error rate of 69%; keep in mind this discredited model is the basis for government lockdowns and facemask mandates, even though the model’s incapable of predicting the number of times an apple tossed in the air returns to earth.
The Penn model is no less of an academic disgrace and is this month’s winner of the “Fantastic Farce” award, with a whopping 82% error rate. The performance of these models are an indefensible embarrassment to both institutions and the fact that faculty in these departments still have jobs and these institutions are still accredited is indicative of the state of academia today. The FEMA model, which represents the federal government’s best crisis management capability, is an equally epic failure with an embarrassing July error rate of 75%. Because Brix/Fauci rely on these failed models, it taints anything they say concerning COVID.
Our simple model comes in with an error rate of 0.01%. What separates our model from the others is we’re trained to objectively apply data to modeling, and to understand both the limitations of a numerical tool and how results are to be interpreted. It’s frustrating that our model contains four lines of EXCEL code and runs on a laptop, yet “experts” can’t develop models that at least comports to observational evidence. To understand why, we must look at the pandemic within our post-pandemic.
We begin by laying down the gauntlet with our August forecast. Keep in mind that in the run up to November elections, the fictious projections made by UW, Penn, and FEMA are likely to get even more fallaciously outrageous. Consider the projected end-of-August death counts; our model predicts 172,903 cumulative COVID deaths, while the big three project a combined average of 464,000. Imagine how different our crisis response would have been if valid models were available.
For our August projection to be valid, 672 people will die from pneumonia, influenza, and COVID (PIC) each day in August. For the big three models to be accurate, 10,062 people will die each day. If you think our model can’t possibly be right, let’s consider a couple collaborating touchstones from two different sources: CDC and Index Mund[4]. According to CDC, the mortality rate from COVID is down 86% from its peak in April[5]. Additionally, influenza like illnesses (ILI) are below baseline endemic levels and have been decreasing the last 15 weeks.
The U.S. percentage of confirmed COVID cases resulting in death at the start of June was 4.79%, which dropped to 3.89% by the end of July, representing a significant increase in survivability; the fourth straight month of improvement. It can be argued this improvement is the result of more testing or that the virus is attenuating, which we would not necessarily expect a naturally occurring virus to do but would expect such behavior from a manmade virus.
In December of 2019, prior to COVID’s release, Index Mundi projected 2,863,859 Americans would die from something in 2020. This translates to approximately 7,846 American deaths per day. Through July month end, 1,666,108 American’s have died, which is 564 fewer deaths than Mundi’s pre-COVID expectation. This means COVID is having a minimal impact on US deaths. If this seems too fantastic, consider that in 2017, 61,000 Americans died from flu and that didn’t even penetrate the news cycle. On the downside, the Mundi statistic suggests an additional 1.2 million Americans are going to die from something before the end of the year, which is both sad to consider, and normal.
In a recent Italian study of COVID deaths, their government announced that 99% of reported COVID deaths involved people with three or more pre-existing conditions and were likely going to die from those conditions this year.[6] The median age of an Italian COVID casualty was 80.5, with only 17 deaths under the age of 50. The Italian study confirms our assertion that COVID is not significantly altering the number of people expected to die this year. This becomes an important topic later when the CDC takes more aggressive data altering measures.
The delta between Mundi expectations and actual deaths was near zero in June and decreased in July, but politicians and the media continue to mislead the country by hyper-sensationalizing the increasing rate of infections, which is a false flag metric since the rate of infection is most likely tied to increased testing. At the same time, the “experts,” ignore the inconvenient truth that U.S. deaths are below pre-COVID expectations.
The unexplored question is what’s motivating continued COVID hysteria when evidence indicates the crisis has abated. An equally poignant question is why are university STEM departments silent while non-STEM illegitimi run rampant with wildly unfounded assertions? The answer is, as the answer’s always been, greed; and the risks of running afoul of research sponsors who profit from the crisis.
After CDC declares the COVID epidemic over in June, politicians ramp up campaigns to convince us we’re still enmeshed in an existential crisis that can only be resolved through their ordained wisdom. Borrowing from the Communist Manifesto playbook[7], liberal governors outlaw church gatherings and funerals; that is until Congressman John Lewis dies and the opportunity for political exploitation presented itself. Then, as if Moses reappeared to expel COVID from their presence, it becomes permissible to sit shoulder-to-shoulder in a crowded church proclaiming to the great unwashed (i.e., you and I), “do as I say, not as I do.”
To all you moms with school age kids, let’s take a moment away from media hyperbole and political narratives for some post-pandemic perspective. Do you know your child is more likely to die from a lightning strike at school then from COVID? There have only been 151 COVID deaths from people 24 years old and younger[8], which is a death rate of 0.00047%. Meanwhile, the probability of being struck by lightning is 0.008%[9] which makes lightning caused death 17 times more likely. I’m collecting data on how many days you held your kids home from school last year to avert certain death by lightening if you care to contribute.
Additionally, and hang on to your freshly poured Chardonnay for this, there are no known cases of an infected child passing COVID to adults. Don’t repeat that to your local school board, or DOJ agents will arrest you for domestic terrorism. Also, and this is where you and I need to be serious, since lockdowns and school closures started, more children have died from suicide and overdoses than from COVID[10]. Our kids need to be in school for their social health, mental health, emotional health, and physical health. As a nation, we picked a horrible time to be leaderless, and regardless of the outcome of the November elections, that’s not going to change, even after we get our nonvaccine vaccine.
Finally, there’s the issue of a post-pandemic second wave, I made my August projection based on available quantitative and qualitative evidence asserting COVID is manmade so any second wave will be innocuous. I pray to God I’m right, because if not, we’re in for a very nasty next couple of months.
Note: This chapter is based on a series of 2020 essays submitted to major media outlets, including the NY Times, Washington Post, and Chicago Tribune. The essays can be found at: https://rmdolin.com/commentary/
Read the entire “Truth and Trust in Crisis,” book
[1] Did the Second Wave of the 1918 Spanish Flu Kill 20 to 30 Million, While the First Wave Killed 3 to 5 Million? – Truth or Fiction?
[2] Shocking Draft FEMA Report Sees 200,000 COVID-19 Cases, 3,000 Deaths Daily By June 1 | HuffPost
[3] Inside the White House’s attempt to message its way out of the coronavirus crisis (nbcnews.com)
[4] IndexMundi – Country Facts
[5] CDC: COVID-19 Deaths Peaked in Mid-April; Down 86% by Week Ending June 20 | CNSNews
[6] 99% of Those Who Died From Virus Had Other Illness, Italy Says – Bloomberg
[7] Karl Marx publishes The Communist Manifesto – HISTORY
[8] Coronavirus: COVID Deaths in U.S. by Age, Race | American Council on Science and Health (acsh.org)
[9] The British officer who was struck by lightning four separate times – The Vintage News
[10] More youth are dying of suicide, overdose than COVID-19 during pandemic: CDC director | U.S. News (christianpost.com)
