Chapter 2 in the R.M. Dolin book, “Truth and Trust in Crisis,” 2021
COVID is the first viral crisis of the digital age with unprecedented access to data that should provide high quality information driving good policy and decision making. COVID burst into our lives in late February 2020, with two academic models shocking our senses with dire predictions of death on a scale not experienced in generations. These models are accepted by the government and media as canonical sources for truth and trust with no serious scientific peer review. Unfortunately, these models are so badly flawed their only useful utility is to promote panic and hysteria. We will review essays and analyzes I generated in 2020 to demonstrate what peer review would have looked like if anyone in government, media, or science bothered with due diligence. Keep in mind as we critic these models, our analyzes not only offer science-based examination of the data but were made available in real time.
Society increasingly relies on computer models and simulations; in the right hands they’re powerful tools but can also be maliciously constructed to provide any desired result. The challenge is using them to realistically capture a phenomenon’s behavior in a manner that facilitates reasonable and responsible clairvoyance. Models are rule-based, meaning they follow a set of rules that when executed, guide a simulation toward its solution. Programmers can build whatever set of rules suits them and are not bound by the constraints of the real world. For example, it’s trivial to stipulate that when the temperature during a storm rises above eighty degrees, rainwater flows uphill even though this is physically improbable. Any program containing this rule simulates summer storms with rainwater flowing uphill.
Computer models lack an ability to recognize when they’re outrageous, absurd, or outright wrong, just as there are no constraints regarding how humans interpret the results of a computer simulation. When I taught numerical methods, I’d begin my first lecture by introducing students to what I called “Dolin’s Fundamental Law of Software Programing,” which states
“All software programs, regardless of how poorly or well written, render an answer and that answer, regardless of how pristine the input data is and how perfectly the program’s executed, is always wrong.”
In the right hands models are oracles of truth but like any tool, they depend on the trustworthiness of both the person supplying input data and the person running the program. To drive the implications home, I’d pose the following problem to my students: “Suppose a computer program has two input variables, a and b. The algorithm consists of execution code that multiples a and b together, (i.e., Output=a*b). The algorithm also contains a rule which states, ‘If a is greater than zero, Output is positive.’ Suppose a=2, and b=-3, what’s the Output value?”
We know a * b = -6, however, the program’s output is positive 6 due to our rule. A somewhat more obtuse point is that the model’s output is not really 6. Numerical programs do not understand abstract concepts like mathematics, instead they rely on the accuracy and precision of the computer, the software compiler, and the input parameters to arrive at a value that is approximately 6, which leads to a discussion of roundoff and error. Precision measures how often the same input a=2, and b=-3, generates the same output to a specified level of accuracy. A lot of what’s wrong with models used during COVID is captured in this simple example. As will be demonstrated, the academic COVID models are poorly written, poorly executed, contain erroneous rules, and the simulation results are poorly interpreted.
As software increases in complexity, the rules governing their behavior also increase due to efforts by programmers to capture every imagined caveat. As more rules are added, additional input parameters are needed to manage the caveats. These additional parameters can be thought of as knobs that are “tweaked” to achieve desired outcomes. It’s no different than the knobs used to adjust home stereos, so listeners achieve their interpretation of stereophonic perfection. This is the slippery slope the COVID crisis found itself on.
Once a program successfully compiles, each time it’s executed, the operator tweaks input parameters to achieve desired outputs. In the case of the COVID models, one set of input parameters (i.e., assumptions) might output results indicating two million people die in the next month, while another set of assumptions could just as easily predict death takes a holiday and no one dies next month. In the hands of unqualified analysts, even well written programs can render flawed interpretations; a phenomenon witnessed repeatedly during COVID as unqualified academics and bureaucrats pretend to practice science. An analogy would be trusting me to overhaul my Cummings diesel, yeah, I’m an engineer and yeah, I know a thing or two about engines, but I guarantee you any attempt on my part to overhaul a Cummings engine does not end well for me or the engine because I’m not a skilled diesel mechanic.
Two academic models accepted as COVID gospel without ever being peer reviewed or even assessed to determine if they provide reasonably realistic projections are from the Imperial College of London (UK) and the University of Washington (UW). The UK model projects in early March, that by October 500,000 Brits and two-million Americans will die from COVID.[1] This alarming prediction causes widespread panic as we implicitly trust model projections from prestigious academic institutions.
To put this prediction in perspective, the UK population in 2020 is 67.9 million, while the US population is 331 million.[2] This means the UK model projects 0.74% of the British population dies from COVID in the next seven months while 0.6% of the US population dies. Forget for a moment there’s little evidence supporting this assertion and consider the difference between 0.74% of the UK population and 0.6% of the US population dying. It could perhaps be argued that the British population is more concentrated, which should lead to higher death rates as there are 660 people per square mile in England[3], while America only has 435 people per square mile[4] and the social distancing imperative is heavily promoted. If we use population density as the causal factor, then to be consistent with 500,000 Brits dying by October, 1.62 million Americans would die in the same period, which means population density is not a likely causal factor in this projection and a fair question one should ask is why the inconsistency?
Perhaps COVID has a stronger presence in the UK when the model’s run, and that overtime the predicted death rates between the two countries equalizes. It could be argued that Brits are less heathy than Americans, but our obesity problem suggests otherwise. The bottom line is that these are the kind of questions that should have been posed to challenge the validity of the UK model, and the Imperial College of London should be obligated to respond by proving their model’s trustworthiness.
This early stage of the pandemic is where the greatest travesty of the crisis occurs; the utter abdication of STEM communities to challenge these dire predictions. Had peer reviews been held, we’d understand how the UK model concluded one death rate for the UK and a significantly different rate for the U.S., and what evidence was used to tweak the input parameters to the point both predictions became unrealistically dire. Had STEM communities done due diligence perhaps the world would have averted what became a data mismanagement dystopia. Imagine how different things might have turned out had the fallaciousness of the UK and UW models been exposed early on. Sadly, academia long ago ceded truthful rigor for populace narratives in areas ranging from climate control to alternate energy.
On average, 36,000 Americans die each year from flu[5] and in 2017, the number jumps to 61,000. In March of 2020, the UK model asserts two million Americans will die from a previously unknown coronavirus in seven months, and no one questions this assertion. This equates to 285,714 COVID deaths per month in addition to the 191,667 Americans per month already expected to die from other causes like heart disease, cancer, diabetes, etc. With death rates projected to increase 250%, consider the impact this has on healthcare and death industries. Faced with such a catastrophic forecast from a prestigious institute, governments on both sides of the pond accept the UK projection unequivocally and use it as a basis for emergency planning, which includes closing the boarders, forcing healthy people into quarantine, shutting down schools, and closing small businesses. Meanwhile, no one asked the most fundamental question of the crisis, “where’s the evidence supporting this projection and has your model been vetted by qualified scientist?”
While government and media proficiently generate public panic, there’s no collaborating evidence supporting these predictions, just opinion, conjecture, and the ability to spin whatever propagandized story they decide to sell. In a digital age that increasingly relies on models and projections as sources of truth, your right to have important matters be based on trusted quantifiable evidence should be absolute.
An interesting observation in this moment of the crisis is that if anyone in government truly believes deaths will skyrocket 250% in the next seven months, why is the level of contingency planning and preparation not on par with the hysteria being promoted? For example, there is no increase in coffin production, no mobile crematoriums are being set up, and the too few military field hospitals sporadically established come nowhere near representing the projected increase in demand. Many observations in these early stages of COVID are not aligned with marketing.
A likely explanation is that our government doesn’t believe the UK model but must appear to be doing something. What government lacks but desperately needs is an equally convincing American model that can be elevated to canonical truth; enter the second academic model of the COVID crisis, courtesy of UW. For reasons UW administrators have never been asked to explain, they allow non-scientists in their medical school to develop and promote what became the primary U.S. standard for COVID truth. By not demanding a thorough peer review, the UW STEM departments abandon their responsibilities to the university and nation; the resulting impact of their abdication is catastrophic.
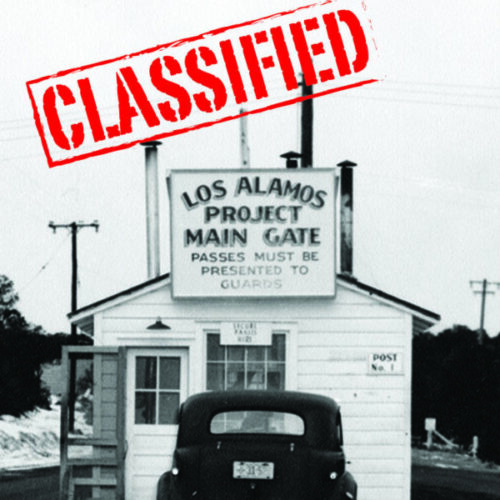
In the 1990’s when virtual reality (VR) is in its infancy, I lead the development of VR capabilities at Los Alamos to simulate nuclear weapons accident response. My research involves teleporting senior scientists into the field to support a response and for that I collaborate with medical communities interested in using VR for telemedicine. I visit the University of Washington as their medical school is involved with this fascinating application of advanced technology; impressed not only with their campus, but with the close collaboration the medical and engineering departments share. It’s disappointing that the UW STEM departments abdicated their academic responsibility during COVID.
If you think I’m unduly harsh on academia and UW, know that in science, trying is not doing and doing is what matters. We are told academia is where the brightest, most free-thinking minds reside, if so, then there’s a quid pro quo obligation academics have for the public’s largess. Consider this, if you’re about to board a newly built aircraft and learn UW engineers designed the cabin decor, but defer structural and flight dynamic design to the medical school do you board the aircraft? That’s basically what happens during COVID, only the UW model is more dangerous because it’s used at a national level for policy planning, and they must be competent enough to understand their predictions are complete nonsense. Demonstrating the absurdity of their model is neither difficult nor time consuming as I will show you using a four-line program written in an EXCEL spreadsheet.
In this early stage of COVID, we implicitly trust CDC data and UW just released their model. It’s mid-March 2020, and a small cadre of scientists who have not yet been canceled are getting suspicious COVID could be human engineered. The basis for my concern reaches back to 2004 when the world is bracing for another Chinese pandemic, only this Avian Flu is far more lethal.[6] I’m responsible for helping develop and communicate the Los Alamos crisis management plan to Department of Homeland Security officials. I’m also involved with developing the New Mexico state pandemic plan and informing the White House federal pandemic plan. Los Alamos develops an Avian Flu model that is used to inform federal, state, and local policy planning.
The final death rate for COVID is 0.17%, while the death rate of the Avian Flu is 68%. To put this another way, 1.7 people die from COVID for every 1,000 people infected while the Avian Flu death rate is 680 deaths per 1,000 infections. You can imagine the planning and policy decisions made based on the Los Alamos model are crucial not only for our survival as individuals, but also for our nation’s survival and as a result, Los Alamos conducts rigorous model peer reviews.
There’s no evidence COVID is a unique pandemic, except for the possibility of it being human caused. Evidence does exist dating back thousands of years that, on average, three global pandemics occur every century. Last century’s three major pandemics are the Spanish Flu of 1918, which kills fifty- to one-hundred-million people, the Asian Influenza of 1957 that kills 2 million people, and the Hong Kong Influenza of 1968 that kills 4 million.[7]
One of the many mischaracterizations the media promoted during COVID was that pandemics are somehow worse than epidemics. Another mischaracterization is that rates of infection are a viable metric for measuring mortality. Infection and death rates have nothing to do with elevating an epidemic to pandemic status. It has nothing to do with morbidity and mortality ratios either. The differential between an epidemic and pandemic is strictly geographical. For example, suppose people get sick in San Diego and the death rate climbs to COVID levels. If the illness is contained to San Diego, the CDC classifies the incident as an epidemic.
Suppose the illness spreads to Tijuana, Mexico, then, we’re dealing with a pandemic because it now involves two geographic regions. Pandemics can be less severe than epidemics but spread over a wider region. This becomes important as we move toward June, when the CDC downgrades COVID. Well, that is until politics enter the fray and pandemic data becomes untrustworthy. That’s when cute marketing slogans like “follow the science,” become a beguiled part of our lexicon. But that’s getting ahead of the story as we’re still back in March, and the UW model has just been christened as our single source for COVID truth and trust. Think of the UW model as a precursor to the role Anthony Fauci ultimately plays.
The Merriam Webster dictionary defines an epidemic as “An outbreak of disease that spreads quickly and affects many individuals at the same time.”
Pandemics are defined as “a type of epidemic (one with greater range and coverage), an outbreak of a disease that occurs over a wide geographic area and affects an exceptionally high proportion of the population. While a pandemic may be characterized as a type of epidemic, you would not say that an epidemic is a type of pandemic.”
Like a balloon that expands then contracts, an outbreak starts out as an epidemic, expands into a larger geographical area becoming a pandemic, and then contracts again to a smaller region and thus returns to epidemic status. When we talk about a worldwide outbreak, it’s a pandemic. When we talk only about that outbreak within a confined region, such as the U.S., it’s an epidemic. The term epidemic is derived from the Greek word epi, which means “upon or above,” and demos, which means “people.” The term is first used by Homer but takes on its current meaning when Hippocrates used it to describe a collection of clinical syndromes, such as coughs or diarrhea, occurring and propagating at a given location. Epidemics tend to be short-lived while a constant presence of an infection or disease in a population is called “endemic;” this is also referred to as a baseline, which is crucial for determining when an epidemic starts and when it ends.
There’s an official threshold defining the start of an epidemic. In general, they occur when an infection/disease (i.e., agent) plus susceptible hosts are present in adequate numbers, and the agent can be effectively transmitted from a source to susceptible hosts. Epidemics result from[8]
- A recent increase in the amount or virulence of the agent.
- The recent introduction of the agent into a setting where it has not previously been.
- An enhanced mode of transmission so that more susceptible persons are exposed.
- A change in the susceptibility of the host response to the agent.
- Factors that increase host exposure or involve introduction through new portals of entry.
Epidemics end when “the number of new reported illnesses [/deaths] drops back to the number normally expected.” The end of an influenza outbreak is reached when the number of infections or deaths drops to a level at or below the number for endemic influenza. For example, the U.S. averages 36,000 flu deaths per year, which includes both pneumonia and influenza. When flu deaths exceed this rate, an epidemic starts and once the rate drops below normal the outbreak is over. This number can be adjusted to a seasonal rate, or an evenly distributed annual rate depending on the circumstances and who’s doing the math. The CDC has formulas for determining the start and end of epidemics.
The endemic death rate for events such as flu typically range from 5% to 7% above what’s expected at the height of a normal flu season. According to the CDC, the COVID epidemic will be over in America when this metric drops below 5.9% more deaths from than expected in a normal year. It’s important to point out that this metric is a combined pneumonia, flu, and COVID (PIC) number.
As we auger into the crisis, we’ll develop a model that accurately predicts when that CDC milestone is achieved, but I warn you, it will be in shocking contrast to the UK and UW models, as well as to other academic and government models that rise in prominence. The model we develop contains a mere four lines of EXCEL code used to accurately predict the monthly death rates for six consecutive months and accurately predict when our COVID epidemic ends. Our model does all that while official COVID models irresponsibly escalate hysteria.
The UW model used to justify lockdowns and enforce mandates, will be compared against our model. Along the way, other academic institutions with no credible STEM credentials, such as the University of Pennsylvania’s Wharton School of Business (Penn), and Harvard University will enter the COVID modeling sweepstakes as well as the government’s Federal Emergency Management Agency (FEMA). We will assess all these models against our four-line program to demonstrate how easy it can be to truthfully model a crisis with sound scientific methods.
We begin our model assessment in March using World Health Organization (WHO) and CDC data to make predictions and assess the performance of official COVID models. It’s important to use data from the time of assessment because CDC has a history of revising data to meet the needs of prescribed narratives, which means we can’t look up the data they report today for a previous analysis because it’s likely not the same as the data the models relied on when projections were made; it’s confusing but critical for our assessments. Keep in mind that our analyzes for a particular period were developed at that time, there is no postmortem modeling.
Our model projections and evidentiary assertions will run counter to what’s being espoused by politicians, the media, and medical experts, who each have narratives needing to be satisfied. We, however, are far less interested in consensus opinion than with auguring through the noise of narratives. As scientists, we understand that so long as our math is sound and our hypothesizes clearly stated, we can withstand pundit criticisms certain to come. It won’t always be easy as I’ll challenge you to trust where the math takes us, even when powerful and loud voices demand you stick to prescribed scripts, but that is the real power and obligation of scientists seeking truth.
Along the way we’ll investigate what can happen when simple foundational science is followed. We’ll explore what real research looks like. You’ll experience the hard road that people of true conviction must take when compelled to stand up and say, “these are my science-backed assertions, and I’m willing to defend them.” It’ll seem at times that even the data is suggesting we’re wrong, but then, the data we rely on is revised revealing we were right all along and when we arrive at that moment of vindication, you’ll understand the profound responsibility science must embrace if it’s to be the arbitrators of truth and trust in the digital age.
Note: This chapter is based on a series of 2020 essays submitted to major media outlets, including the NY Times, Washington Post, and Chicago Tribune. The essays can be found at: https://rmdolin.com/commentary/
Read the entire Truth and Trust in Crisis book.
[1] https://www.dailysignal.com/2020/05/16/the-failures-of-an-influential-covid-19-model-used-to-justify-lockdowns/
[2] https://www.worldometers.info/world-population/uk-population/
[3] https://worldpopulationreview.com/countries/united-kingdom-population
[4] https://www.states101.com/populations
[5] https://usafacts.org/articles/how-many-people-die-flu/
[6] https://www.ncbi.nlm.nih.gov/pmc/articles/PMC343850/
[7] https://www.atlas-mag.net/en/article/20th-and-21st-century-s-major-pandemics
[8] Kelsey JL, Thompson WD, Evans AS. Methods in observational epidemiology. New York: Oxford University Press; 1986. p. 216:
