Chapter 15 in the R.M. Dolin book, “Truth and Trust in Crisis,” 2021
“There are lies, damn lies, and statistics” – Mark Twain
We began our COVID crisis assessment trusting government assertions while assuming academic projections are truthful. To bound our suddenly terrorizing world, we applied simple math to assess if COVID behaves as a naturally occurring virus and then to assess the extent government and academic claims misalign with observation. Our analyzes increase concern the crisis is being intentionally sensationalized even though reasons remain elusive. This leads us to model COVID with a four-line spreadsheet program that consistently is spot-on accurate while academic models used for policy and planning scandalously over-predict COVID deaths by factors of ten.
Analyzing COVID data using multiple models that each provide elements of insight, lead us to realize data is intentionally being falsified to promote narratives. Again though, reasonable rational for why remain elusive. We compare death data with both pre-COVID actuarial projections and in-situ data from other countries, furthering our conclusion that U.S. COVID data is being propagandized. We then demonstrate the extent to which government agencies are complicit in obfuscating data, further diminishing trust in the truthfulness of crisis managers. We find evidence of medical professionals falsifying death data, further depleting our trust in crisis truth.
Allowing ourselves to go where the math takes us, we openly challenge our conclusions and accept the perilous probability pundits will dismiss our findings as biased conspiracy theory. With that as background, we arrive at the most profound inquiry of this crisis requiring we once again seek creative avenues of truth and trust to untangle COVID’s most carefully conceived misdirection. The challenge will be finding an independent source of truth that can be trusted, validated, and applied to assess the extent recent CDC reports have been obfuscated. For that, we turn to private sector financials, because money, unlike most other data sources, doesn’t lie, doesn’t have a narrative or agenda, and doesn’t obfuscate.
Joseph Stalin famously said, “It’s not the people who vote that count, it’s the people who count the votes.” When it comes to COVID, it matters how the dead get counted – and who’s doing the counting. For example, there’s a distinct difference between those who die from COVID and those who die with COVID. The CDC admits now that 94% of the deaths they attribute to COVID were likely caused by something else. This validates an earlier assertion that the most trusted baseline for assessing COVID’s impact is the total number of deaths from all causes.
What we haven’t considered to this point is the possibility that the number of reported deaths is also being misrepresented? We’ve yet to present evidence of such a conspiracy, so, the issue becomes both what that means and finding a way to prove it. We previously established COVID death data is being inflated to fit government narratives, which means a year’s worth of death data is corrupted. While it’s no longer possible to know how people died, we at least know how many died. We have thus far relied on CDC reporting that has proven untrustworthy, which suggests the need for alternative sources of validation.
The implications of government, media, and medical professionals intentionally misrepresenting death data is hard to imagine and crumbles the very foundations of our nation. It also impacts our economic, medical, and social infrastructures because in the digital age, they all depend on actuarial data that depends prior data to make projections. To pull off such subterfuge, the government has to obfuscate data in ways that deflect challenge and stymie investigation, which isn’t impossible given they control the data. A requisite source of independent data verification needs to be found outside the control of government; a source whose truth is implicitly trusted. Imagine the arc of discovery resulting from an assessment of such unicorn data.
We have shown that through the first nine months of 2020, the number of American’s who died from all causes, included COVID, trended below pre-COVID actuarial expectations, implying COVID’s impact is minimal. In last three months though, something profound happened causing CDC reported death data to skyrocket upward at an unprecedented rate without penetrating a single news cycle.
Table 15.1 U.S. Actuarial Death Data from 2010 Through 2021.
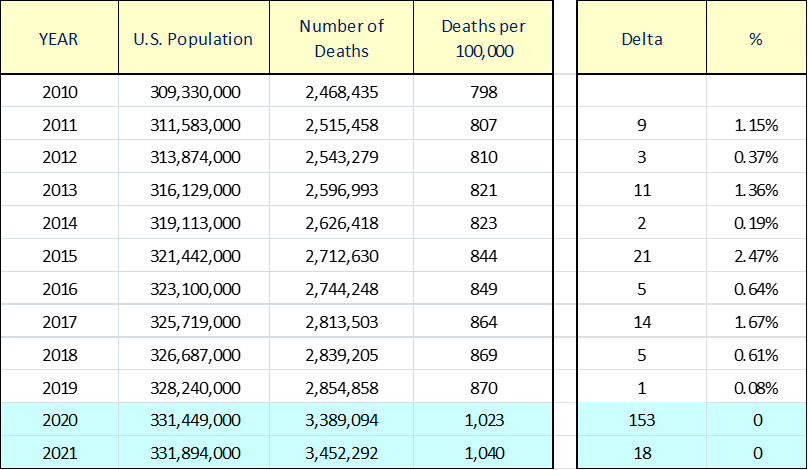
The metric for comparing deaths across multiple years is deaths per 100,000 because of population changes. Table 15.1 shows that each year the death rate increases, which could be caused by things ranging from an aging population to being less healthy. Between 2010 and 2019 the average rate of increase in the number of deaths per 100,000 increases 1.08% with the largest jump of 2.53% occurring in 2015.
In 2020, the death rate tracks to pre-COVID projections through the first three quarters then skyrockets in the last quarter to finish the year up 17.56%. On first blush this dramatic increase seems on par with crisis hysteria. What’s intriguing though, is the official numbers now being reported in Table 15.1, don’t coincide with the CDC death data reported during the last three months of the year.
In 2021, CDC revises their 2020 death data citing that 3,389,094 people died in 2020 from all causes. This is 548,363 above pre-COVID expectations and above what CDC reported at the end of the year. It’s difficult to reconcile that we track deaths through the first three quarters of 2020, as they consistently lag expectations as COVID rages; then, while the crisis is abating, the rate suddenly surges. The U.S. death rate through the first three quarters of 2020 averages 774 deaths per day. Then, we’re told the rate jumps to 4,495 deaths per day in the last quarter, an existential increase of 481%.
Given the hysteria we lived through the first three quarters of the year over 774 deaths per day, imagine the mass hysteria that would result if the death rate really shot up 481%. This is where our Alice in Wonderland world dives down the rabbit hole because, instead of increasing mandates and re-closing Bob’s Boot Barn, most states rescind their restrictions. In science, one observes, then concludes based on observations, and always, conclusions must be consistent with observations, only now they’re not.
To delve deeper into this inconsistency, let’s approach the problem from a different and nonCDC dependent perspective. The IndexMundi Deaths Clock[1] provides a real-time accounting of how many people have died. Because financial institutions rely on actuarial data for planning and decision making, their assessments are trusted – at least to the extent their data sources are trusted. According to actuarial analysis, 2,854,838 Americans died from something in 2019, and pre-COVID expectations were that 2,901,480 Americans would die in 2020.
At the end of 2020, CDC reports that 2,913,144 Americans died during the year.[2] This is an increase from 2019 of 0.65%, which is below the ten-year average year-to-year increase of 1.08%. We could conclude that 0.65% is not significant, but it must be since we shut down the country, locked up 322 million healthy Americans, and mandated everyone wear facemasks that don’t work. Meanwhile, notice that in 2015 the year-to-year increase was 2.53%, yet there were no quarantines or facemasks. In 2017 the increase was 1.7% and not a single small business was shuttered, and kids got to have proms.
In 2021, the mathematics of COVID incurs what mystery writers refer to as a plot twist; that’s when CDC revises their initial 2020 end-of-year death count from 2,913,144 to 3,358,814; an increase of 15.3%. It’s not uncommon for government data to be revised; it’s a monthly occurrence in labor reports. However, miscounting something as important and easy to assess as deaths by almost 450,000 from an agency we depend on to accurately monitor such things is suspect.
Fueling our suspicions is CDC’s long history of fabricating facts[3], for example, they admit that 94% of previously reported COVID deaths were caused by something else. The CDC also admits to overstating the number of Americans who have been vaccinated by millions,[4] and this is an incredibly easy number to track since every vaccination comes with a profit payout, which begs the questions did taxpayers get billed for the actual number of the falsified number and are doctor’s ethics again suspect?
We have a discrepancy of 445,670 deaths between what CDC initially reports then later revises upward. If government controls the data and CDC cannot be trusted, a trusted way of establishing truth must be found. There is an avenue at our disposal if you concede a foundational truth; namely, money never lies if you ask the right question. We query then the monetary oracle of truth in the form of a hypothesis,
H15.1: When someone dies, their body is dispositioned.
We test our hypothesis with an observation; namely, when someone dies their body goes to a funeral home where they’re placed in a casket, when cremation’s the ultimate disposition there is also an urn. This means if a crisis causes 445,670 unanticipated deaths within a three-month period, casket manufacturers and funeral home operators experience a sudden and massive surge reflected in a corresponding revenue surge. I concede I’m drifting into MBA swim lanes but indulge me as I follow the math; MBAs are encouraged to peer review the analysis because I want to be wrong.
Most businesses rely on actuarial data for planning. If in early 2020, actuarial indicators suggest normal increases in demand, appropriate investments in materials, manpower, and distribution are made. If an unexpected demand surge occurs, say due to a pandemic, one of two outcomes result, either demand goes unmet, or revenues sharply exceed expectations. The Batesville Casket Company is a preeminent American casket manufacturer[5]. Figure 15.1 shows their reported revenues, which are required by law to be truthful and accurate, fail to meet market projections in both 2020 and 2021.[6]
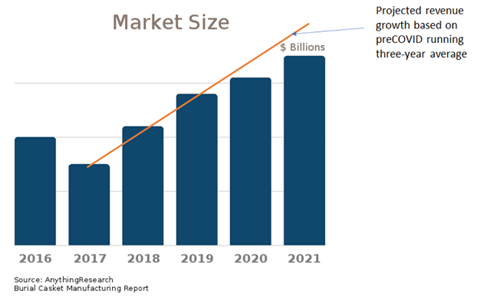
Figure 15.1 Revenue Growth for Casket Industry from 2016 to 2021.
Table 15.2. Normalized Revenue per Death for the Batesville Casket Company.
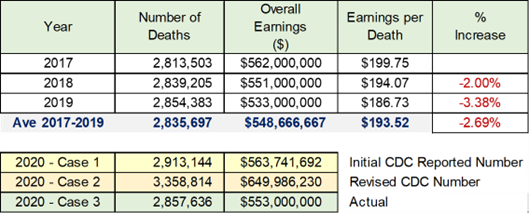
It’s not plausible that 445,670 unanticipated deaths occur in fourth quarter of 2020, with no bump in casket revenues. Table 15.2 shows that between 2017 and 2019, the Batesville Casket Company makes on average $199.03 per funeral. From this data we can estimate expected 2020 revenues based on both initial CDC end-of-year 2020 data and their revised data to see which more closely matches marketplace realities (i.e., ground truth).
The average annual revenue from casket sales from non-COVID years 2017 to 2019, was $548,666,667. For 2020, the Batesville Casket Company reported revenues of $553 million, which represents an increase of 0.78%. Based on the average revenue per funeral, in 2020 the casket industry serviced a demand of 2,857,636 deaths. This suggests that if 3,358,814 Americans died as the CDC asserts in their revised data, 501,178 Americans didn’t have a funeral. Raise your hand if you remember the relentless news cycles regrading half-a-million Americans denied a funeral.
Imbedded in the funeral and casket numbers are those who choose cremations, so the disparity between the number of revised CDC deaths in 2020 and the number of caskets produced is not due to cremations. I share your concern that given the significance of the allegations, one data point of evidence is insufficient and additional sources of validation are required to validate distrust in government.
Let’s address validation from a different but equally accurate angle. When someone dies, they process through a funeral home, regardless of their burial or cremation outcome, so we can draw the following hypothesis:
H15.2: “When X people die X funerals are performed.”
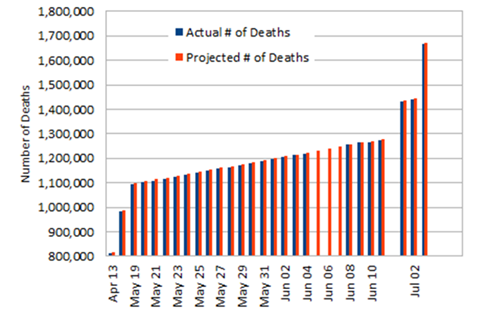
When a person dies, it causes a casket to be sold and a funeral to be processed. Therefore, we expect a 1:1 correlation between casket and funeral home revenues. In addition, we expect a causal link between deaths and casket/funeral revenues. If causality exists, we validate our trust in this data because unlike government reporting, businesses are lawfully required to truthfully report financial information. Figure 15.2 shows funeral home revenue from 2008 to 2020. The red line is a linear approximation of the rate of revenue growth over time. Based on performance trends over 13 years, funeral home revenues fail to meet 2020 pre-COVID expectations. In other words, COVID does not cause an increase in 2020 funerals.

Figure 15.2. Revenue Growth in the Funeral Home Industry from 2008 to 2020.
Table 15.3. Funeral Home Revenue from 2015 to 2020.
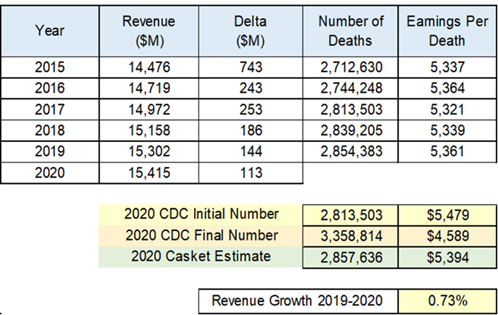
There are 19,322 funeral homes in America[7] performing on average, three funerals per week. I don’t know if this is maximum capacity but based on the MBA principle that successful businesses operate near peak efficiency, 19,322*3*52 = 3,015,792 is approximately the maximum number of deaths that can be processed per year.
In 2019, industry revenues are $15.302 billion, which equates to $5,361 per funeral, with 42% of funerals ending in cremation. Table 15.3 summarizes funeral home revenues from 2015 to 2020. In general, the year-to-year revenue increases are trending smaller, which is probably due to more people opting for less expensive cremations. Since there’s a discrepancy as to how many Americans died in 2020, we can use initial and revised CDC death data along with casket industry data to estimate funeral home revenues for each scenario. Notice that of the three scenarios, casket industry revenue most align with funeral revenues, which implies strong correlation.
If the revised CDC numbers were accurate, the year-to-year increase in American deaths between 2019 and 2020 would be 15%. However, the increase in casket revenue in this period is only 0.78%, and the increase in funeral home revenue is only 0.73%. While there’s no causal link between CDC reported deaths and revenues for either the casket or funeral home industries, the two industries are causally connected. It’s not plausible there could be a 15% increase in deaths but less than a 1% increase in casket and funeral home revenues, which implies the CDC death data is not correlated with industry revenues.
Since there was no reported shortage of caskets or any funeral backlogs in 2020, we can conclude every death in 2020 was properly processed. Since 2020 revenues for both the casket and funeral home industries fall below pre-COVID projections, the revised CDC surge in American deaths in 2020 does not seem likely. Further validation comes from the fact that the initially reported CDC 2020 death data strongly correlates with casket and funeral home revenues suggesting the initial CDC reported death data for 2020 is more likely.
Two industries required by law to file factually accurate reports have identical outcomes, namely that the increase in American deaths in 2020 is below pre-COVID estimates, which comports to the actuarial data we tracked throughout the year. This suggest a reasonable approximation to the number of Americans who died in 2020 is 2,875,934, or an increase of 21,551 from 2019, which astonishingly tracks to the number our simple model projected way back in March.
Table 15.4. Pre-COVID Expected Deaths in 2020 versus Reported Deaths.
This seems an unbelievably low approximation given government and media narratives assert millions have died from COVID. It’s worth noting that at the beginning of 2020, IndexMundi expected 2,863,859 Americans to die by the end of the year and for most of 2020, their Deaths Clock tracked closely to this expectation, as shown in the Table 15.4. Projecting the slope of Table 15.5 out to the end of year indicates it’s likely 25,546 fewer Americans died in 2020 than was expected pre-COVID. There are extenuating circumstances making this possible, for example, elective surgeries were interrupted in 2020, which means the expected 440,000 doctor-caused deaths are reduced. Of course, as pointed out earlier, there are also extenuating circumstances driving numbers up.
The unexplored question is why would CDC misreport 2020 death data? Why does IndexMundi data track to ground truth throughout the year while politicians and media work to convince us otherwise? Is there possibly something going on late in the year that determines the fate of the nation, say something possibly in the first week of November? One can speculate on a plethora of motivates, such as the billions/trillions medical professionals and BigPharma make from COVID, etc. The problem is, we don’t know, at least not yet.
Another possibility is that CDC is willfully incompetent. Perhaps they double count people who die from COVID with people who die with COVID; after all, they already admitted to commingling these two demographics. But even if such Shangins prevail, it doesn’t address why CDC data tracks to IndexMundi all year before CDC dramatically revises their data. One thing’s certain, there’s no way government comes clean on this and medical professionals made such a mess of obfuscating death data there’s little chance of unraveling their malpractice. What we can do is count caskets and funerals and assess that data to conclude there was no late year COVID surge, which flies in the face of everything marketed to heighten our madness.
If coffins and cremations can’t convince you something’s amiss, let’s find further validation in another equally causal sector. In 1979 there were 1,465,828 hospital beds[8] in the U.S. but by 2022 that number dwindles to 920,531, with 13.5% (124,272) ICU beds[9]. During this time the hospital industry transitions from primarily nonprofit community-based hospitals to for-profit corporate conglomerates. Privatization drives optimization so to maximize efficiency, fewer beds in hospitals running near capacity become the operational norm.
In June of 2021, hospitals average 12,041 COVID patients, or 1.3% of capacity and their COVID death rate is 1.25%, which means that for every 125 patients admitted with COVID conditions, one dies. The peak of COVID hospitalizations occurs in January 2022, when 145,000 COVID patients[10] are hospitalized, representing 15.7% of hospital bed capacity, mostly from patients not requiring ICU care. If 12,041 patients are hospitalized per week in 2020 and the death rate reported by CDC is 1.7% of those infected, the year-end expected number of deaths would be 10,644. The CDC initially reports 972,000 people died from COVID in 2020 and 2021, but then in 2022, quietly revises the number down to 58,320, or 29,160 per year. This equates to 32,986 COVID hospitalizations per week, which is more than the hospital industry reports and significantly less than CDC revised data reports.
If the revised CDC 2020 death count combined with 445,670 more deaths than expected due to COVID are true, this equates to 504,151 COVID hospitalizations per week, or 55% of hospital capacity. However, the peak COVID hospitalization is only 145,000 per week, and that’s only sustained for one week in 2022. In other words, U.S. hospitalization rates do not support the revised CDC death data but do comport to initial CDC end of year data. This analysis of hospitalization data validates the earlier casket and funeral industry analysis; namely, the initial CDC death data in 2020 is likely correct and COVID did not result in millions of Americans dying as revisionist CDC data asserts.
Table 15.5 United States Death Rates from 2014 to 2024 According to United Nations Statistics.
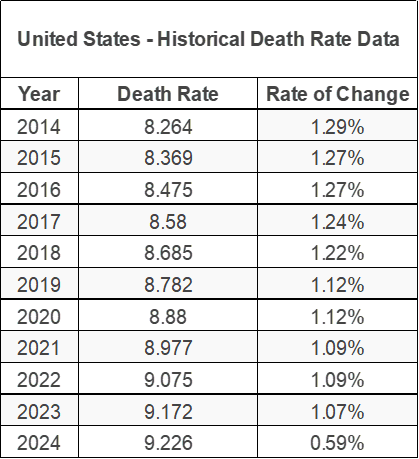
Epilogue: During a crisis as catastrophic as COVID, we expect the death rate (i.e., # of deaths per 1,000 people) to dramatically increase from previous non-COVID years, but this does not appear to be the case. According to United Nation’s population data, the death rate in the U.S. saw no COVID bump in either 2020 or 2021 as shown in Table 15.5.[11],[12] This UN data is consistent with pre-revised CDC data.
The average death rate change from 2014 to 2024 is 1.12% per year, with the highest year-to-year death rate change being 1.29% between 2013 and 2014. The year-to-year death rate change between 2019 and 2020, the first year of COVID is 1.12% and the death rate between 2020 and 2021 is 1.09%. Notice that during both COVID years the rates of change in the U.S. death rate for the two COVID years are the among the lowest rates in a ten-year period and is consistent with initial CDC reporting. In other words, the U.N. data suggest that COVID did not cause an increase in U.S. deaths, which not only runs counter to the expected outcome given the hysteria caused but invalidates CDC reported death data. This finding is, however, consistent with our analyses from other sources.
Note: This chapter is based on a series of 2020 essays submitted to major media outlets, including the NY Times, Washington Post, and Chicago Tribune. The essays can be found at: https://rmdolin.com/commentary/
Read the entire “Truth and Trust in Crisis,” book.
[1] United States Deaths Clock – IndexMundi
[2] TOTAL US DEATHS 2014,2015,2016,2017,2018,2019 & 2020 (myessentialnews.com)
[3] Press Release (wordpress.com)
[4] Report: CDC overcounts millions of vaccinations (yahoo.com)
[5] Batesville | Batesville Casket Company
[6] 2022 Burial Casket Manufacturing Industry Statistics & Market Research Report – AnythingResearch
[7] 37 Funeral Industry Statistics and Trends – BrandonGaille.com
[8] Hospital beds number U.S. 1975-2019 | Statista
[9] How Many ICU Beds Does A Hospital Need? – The Hospital Medical Director
[10] Number of COVID patients in US hospitals reaches record low | Fox News
[11] World Population Prospects
[12] U.S. Death Rate 1950-2025 | MacroTrends
