
Chapter 3 in the R.M. Dolin book, “Truth and Trust in Crisis.” 2021
In late March of 2020, based on dire predictions from academic models, the government announces an effort to spread the millions of projected COVID deaths over a wider timeline so as not to overwhelm death and dying industries; their marketing their campaign is based on the mathematical concept of “flattening the Curve.”[1] Imagine two triangles of different shape having the same area. Suppose one triangle is half as tall as the other; to have the same area, the shorter triangle’s base must be twice as wide as the taller triangle. In “flattening the curve,” the area under the curve represents the number of people projected to die, and the base is time; to spread out the number of deaths over a longer time, the curve’s apex is lowered or flattened. To flatten a curve, the rate of change (i.e., slope), is minimized, which means reducing the rate at which the number of deaths increases over time.
As part of the effort to flatten the curve, drastic mitigation measures, such as quarantining healthy individuals and shutting down commerce, except those deemed “essential” are enacted. We’re told these mitigation measures will last two, possibly three weeks, and then our lives can return to normal. However, long after the CDC declares the crisis over, many of the mitigation measures linger in effect.
To give COVID a mathematical context I published an essay on April 1, titled “Earthquakes, Gypsy Moths, and the President’s Dire Warning.”[2] The essay reviews the government’s prediction that in two weeks (i.e., April 14th), COVID death rates reach an apex then begins start to lower. From February 27th when the first COVID death is reported until April 1st, there have been 3,900 COVID deaths in America and President Trump introduces two new members to his White House Coronavirus Task Force, medical doctors Deborah Brix and Anthony Fauci. I’ve never met Dr. Fauci[3], but was involved in cleaning up one of his messes. In 2005, 5,000 samples of a deadly virus strain responsible for over two million deaths in 1957, are accidentally sent to bio-labs in seventeen countries, including some hostile to the US.[4]
While that’s the official story, talk around the homeland security water coolers is that Fauci’s National Institute of Allergy and Infectious Diseases (NIAID)[5] inadvertently released the unattenuated Spanish Flu virus responsible for one-hundred million deaths. NIAID apparently obtained the unattenuated virus strain by exhuming a WWI solider who died from Spanish Flu. The scary part of this calamity is we have no immunity to the unattenuated Spanish Flu and if true, is the greatest act of medical malfeasance in human history.
Based on academic model projections and their own predictions which are never explained and never held for peer review, Brix/Fauci announce the COVID death count in America is about to explode from 3,900 deaths to 250,000 deaths in two weeks (April 14th). This sudden assertion shocks our sensibilities, particularly since less than 4,000 American’s have thus far died from COVID, which is well within the expected bounds of a normal flu season. Their assertion is so spectacular and unprecedented in the history of viral pandemics it demands evaluation.
My initial foray into COVID modeling is not to prove or disprove the crazy claims being made by Brix/Fauci, but to determine if COVID is human caused, which I’m beginning to suspect based on zealous government over reaction. The only plausible way the death rate can jump from 2,000 deaths per month nationwide to a rate of 500,000 deaths per month, is if the coronavirus was genetically modified. To put this level of virulence in perspective, the Spanish Flu claims 675,000 American lives for an average of 28,125 deaths per month.[6] Since the US population at that time was one-third what it is today, the adjusted rate in terms of our current population would be 84,375 deaths per month. The Spanish Flu remains the deadliest viral pandemic in recorded history, so claiming COVID is six times more virulent seems improbable for a naturally occurring virus.
While brainstorming ways to prove COVID’s manmade, I consider what would motivate such research. There’s it’s obvious use as a bioweapon but there’s a global moratorium on biological weapons research and the Chinese would never violate that, right? And certainly the U.S. would never engage in something as illegal, dire, and diabolical as funding such research offshore to circumvent President Obama’s executive order outlawing gain of function research.[7],[8] I consider the possibility that China developed COVID to deal with the demographic issue of having too many elderly citizens relative to younger adults. While horrendous to consider, the Chinese communists have previously demonstrated a willingness to murder over 50 million people. An aspect of COVID causing me to suspect its manmade is that, unlike the Spanish Flu that mostly killed young adults, COVID’s targeting the elderly and infirmed.
Adding to my suspicions, there are no dead bats. Whenever an avian pandemic arises, there are dead birds all over the place with photographic proof. When swine flu runs rampant, pigs are put down, again with demonstrative videos and pictures. When equine flu rears its ugly head, horse herds are euthanized, and evidence abounds. Here we are, in a pandemic reportedly six times worse than the worst pandemic in recorded history with no evidentiary bats.
While I can’t prove COVID’s manmade; I can prove the null hypothesis[9], which means proving COVID behaves like a naturally occurring virus. Null hypothesizes are used for proving the opposite of what you really want to verify. To prove my null hypothesis, we’ll utilize exponential functions, which are routinely used to model naturally occurring events like earthquakes, machinery wear, and gypsy moth reproduction. Before demonstrating what any of these have to do with COVID, we need a short tutorial on exponential functions and how they can be used to prove that COVID either does, or does not, behave like a naturally occurring virus.
You’ve probably heard expressions such as “the stock market’s taking-off exponentially,” or “the exponential half-life of plutonium-239 is 24,110 years.” Expressions like these describe the rate at which something changes, and in nature things tend to follow exponential growth and decay patterns. For the past month, I’ve been charting COVID data with linear functions, which are simplest form of mathematical modeling. Exponential functions are almost as simple while being exponentially more profound.
Exponentials are a base number raised to a power, for example

which implies the number 2 raised to the x power. If x=2, this expression becomes two-squared, which equates to
You probably remember this from high school algebra, but it’s worth reviewing since it becomes a linchpin in our assessment of official COVID models.
The term “exponential growth” refers to a condition in which each time x increments by one value, the function increases by a multiple of its base. As shown in Figure 3.1, exponential functions start out small and grow rapidly. In our example, f(x)=2x, each time x increments by one, the function doubles because the base is two. So, for x = 1, 2, 3, 4, 5 . . .14,
f(x) = 2, 4, 8, 16, 32, . . . 16,384.
For a simple exponential like f(x)=2x, after only fourteen cycles, f(x) grows from 2 to 16,384. We can use exponentials to determine if it’s possible the COVID death rate can increase from 2,000 deaths per month to 500,000 deaths per month in fourteen days.
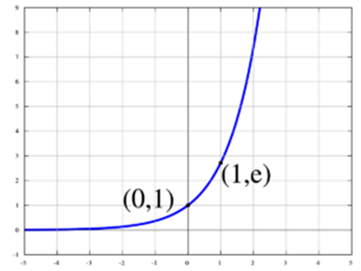
Figure 3.1. Typical Plot of an Exponential Function.
In a famous parable, a king asks a craftsman to build him a chessboard.[10] When it’s time to pay, the craftsman tells the king to pay him one grain of rice for the first square on the chess board, two grains of rice for the second square and so on, doubling the grains for each square. The king quickly agrees, and the first row of payments are 1+2+4+8+16+32+64+128=255 grains of rice.
What the king fails to understand is that by the time they reach the 64th square of their f(x)=264 exponential model, he’ll owe the craftsman over a trillion grains of rice. To escape handing over his wealth, the cleaver king says he’ll pay as agreed, but the craftsman must count each grain to ensure he’s paid in full. Understanding it’ll take hundreds of years to count a trillion grains of rice, the craftsman tells the king to keep the chessboard as a gift.
This example demonstrates its exponentially possible to model the death rate asserted by Brix/Fauci, what remains unanswered is if it’s probable and supported by evidence? Keep in mind we’re not attempting to prove or disprove their assertion, that will come later, we’re attempting to prove or disprove whether COVID behaves like a naturally occurring virus.
To catapult from the current 2,000 COVID deaths per month to the projected rate of 500,000 deaths per month in fourteen days, we need an aggressive exponential. We know our function is of the form, f(x)=ax. We also know x=14 and that Brix/Fauci assert 250,000 Americans die in fourteen days. What we don’t know is the value of a. Without getting too mired in math, to get the cumulative number of deaths on this date, we must integrate our function, which results in the equation,
Solving for a, we get, a=2.4097. While it seems unlikely the Brix/Fauci assertion or academic projections could be correct for a naturally occurring virus given the world has never encountered such a deadly pandemic, demonstrating their outcome is mathematically possible means COVID could be a naturally occurring virus. This does not, however, negate the possibility the virus was engineered to possess naturally occurring behavior.
Brix/Fauci make their assertion citing the UW model, which we’re told is based on an elaborate set of parameters and variables we lay-folks have no hope of understanding. Since we’re too ignorant for academic sophistication, let’s develop a simple mathematical model using exponentials that can be programed in any spreadsheet using four lines of code. We’ll then use our model to assess the accuracy of academic projections and government assertions.
We’ve been told the world’s about to end; the problem is Americans aren’t getting on board. Sure, we hoard toilet paper, but is it because we fear the end of days or because we don’t want Doris down the street telling us, “I told you so,” when she finds us foraging for a few squares after taco Tuesday?
To facilitate onboarding, the White House reiterates on April 2, that 250,000 Americans are going to die from COVID in the next twelve days. So dire is this prediction we’ll do anything to flatten the curve. Sure Dr. Brix seems to come from nowhere with limited credentials, but the scarves are reassuring. While Dr. Fauci has a track record of screwing things up, including the greatest act of medical malfeasance in human history, President Trump’s chosen these fine folks to lead us through the darkness and he’s the self-proclaimed master of recognizing talent. So, we implicitly trust Brix/Fauci are the two best and brightest crisis leaders.
Without raising a skeptical hand to ask a question or challenge their assertion, we agree to things that have never been done in the history of pandemics, like quarantining a healthy population and shutting down a nation’s economy. But our leaders with the help of media and medical professionals, convince us that if COVID’s going to reach a dystopian death rate of 500,000 deaths per month by April 14th, it requires equally proportioned mitigation measures – at least that’s our thinking before running some numbers. Figure 3.2 shows COVID behavior through April 2, using data from WHO and the CDC.
Figure 3.2. WHO and CDC COVID Data Through April 2, 2020.
CDC reports, on April 1, 3,900 Americans have died from COVID. While tragic, this is far below what’s required to reach 250,000 deaths in thirteen days. On April 2nd, the number jumps 1,216 for a cumulative total of 5,116. While tragically significant, this remains far short of the Brix/Fauci assertion.
To get from the reported 3,900 COVID deaths on April 1st to the predicted 250,000 deaths by April 14th, the number of deaths would have to increase by factor of 2.4097 each day in our exponential model. However, the increase in the number of deaths from April 1st to April 2nd is 1.31. This means either 1) the Brix/Fauci assertion is wrong, 2) the CDC death data is wrong, or 3) mitigation measures are working. Since at this stage we have no reason to question the veracity of academic models, the validity of Brix/Fauci assertions, or the integrity of CDC data, the measures being taken are flattening the curve must be working; only their effects can’t have made an impact yet.
There is, however, the possibility the “curve” never needed flattening in the first place because the government assertion is not reasonable. Faced with an increasing sense that government assertions based on academic projections are wrong, I begin compiling collaborative, albeit ancillary, evidence and what better place to start than China where this confusing crisis began, and of course Italy where the full force of COVID is right now running rampant.
We have no reason not to trust government assertions, the validity of academic models, or CDC data, the Chinese, however, appear to be underreporting. China reports the number of deaths due to COVID are 2,500 as of April 2. Meanwhile, Radio Free China (RFC) estimates 48,000 have died. Rather than argue who’s right, let’s run some numbers to make our own mathematical determination. For that we’ll assume COVID impacts all demographics equally and generate a statistical inference utilizing data from Italy because they’re further into their crisis than any other country. Also, Italy seems to represent a worst-case scenario amongst truthfully reporting nations, and one would expect with China’s overcrowding, poor standard of living, and lack of access to quality healthcare, that their numbers would be as bad as, if not worse, than Italy’s.
There are 1,437,843,661 (~1.44 billion) people in China. The Italian infection rate is currently 0.16% with 11.3% of those infected dying. For comparison, U.S. rates are currently 0.067% and 2.37% respectively, so we’re currently fairing far better than Italy. If the PRC experiences the same infection and death rates as Italy, then China would have 2,232,214 infections with 256,343 deaths. In other words, two orders of magnitude more deaths than officially reported. This suggests that official PRC claims are likely Chinese misinformation.
As we work through the COVID crisis you’ll come to appreciate that every nation has a narrative. Some narratives require underreporting while others are only achieved by over-reporting. At this point we implicitly trust academic projections and government assertions and compliantly go along with any mitigation measure because Armageddon is creeping up our unlit stairway. However, assessing COVID data from China causes skepticism in all sources of data, including the CDC. So, let’s dip our toes into the data integrity pond and see where it takes us.
Inferring Italian statistics on China’s population, suggests the number of Chinese deaths is a hundred times higher than official reporting. We can apply the Italian inference to the U.S., whose population is 320 million, or 22% of China’s population. To get to 250,000 deaths, we’d have to experience a crisis four times worse than Italy, which seems unlikely given the U.S. has good health care, a government that’s been extremely proactive, and a healthy population. Inferring Italian statistics on America’s population suggests 30,500 American die from COVID by April 14th.
While academic projections and government assertions have 250,000 Americans dying by April 14th, our analysis suggests a more likely estimate is 30,500. It may be difficult to believe our prediction given its so far below expert outcomes, but science requires the courage to stand confidently behind your conclusions, solid in a belief you laid out a logically consistent argument supported by defensible mathematics and valid data.
Our efforts to prove COVID is manmade inadvertently places us on a new trajectory, one of assessing the impending Armageddon. Our new avenue of investigation involves understanding academic projections and government assertions that don’t seem grounded in logic, solid science, or observational evidence. We’ll stay on this trajectory at least until April 14th, which is when, according to crisis experts, Armageddon arrives. However, if our model is correct, only 30,500 Americans will have died by April 14th and Armageddon will have been averted. While still an uncomfortably large number when you remember we’re predicting American deaths, given the dire official scenario, our outcome is the one we should be hoping for. If we’re right, it opens new lines of inquiry, namely was the nation diverted away from Armageddon due to mitigation measures or were we never on track to realize the academic projections.
It’s only April 2nd, and we have twelve terrorizing days to go. Through the power of math though, we are at least confident Armageddon can be averted.
Note: This chapter is based on a series of 2020 essays submitted to major media outlets, including the NY Times, Washington Post, and Chicago Tribune. The essays can be found at: https://rmdolin.com/commentary/
[1] Flattening the Curve for COVID-19: What Does It Mean and How Can You Help? (uofmhealth.org)
[2] http://rmdolin.com/qd-17/
[3] https://www.newscientist.com/article/dn7261-pandemic-causing-asian-flu-accidentally-released/
[4] https://www.nytimes.com/2005/04/13/us/deadly-1957-strain-of-flu-is-found-in-labtest-kits.html
[5] https://www.niaid.nih.gov/.
[6] https://www.healthaffairs.org/do/10.1377/forefront.20210329.51293/
[7] hU.S. halts funding for new risky virus studies, calls for voluntary moratorium | Science | AAAS
[8] Obama Administration Freezes ‘Gain-of-Function’ Research on Influenza, Other Pathogens – California Healthline
[9] https://corporatefinanceinstitute.com/resources/knowledge/other/null-hypothesis-2/
[10] https://purposefocuscommitment.com/wisdom-story-king-con-artist-chessboard-rice/
