
For other COVID posts, visit my Quarantine blog.
We have reached the end of May, which is time to check in on the major COVID models to see how well they’ve predicted the crisis. It’s also time to see how well my simple first principles model stacked up. First we need to take stock on how the crisis has evolved during the month. Recall that the basis for our data is CDC reporting even though as we have discussed in previous blogs, they over count COVID deaths by a minimum of 25%. At the beginning of May, the CDC reported 63,023 deaths and by the end of May, that number had climbed to 103,153, which means the delta (number of people who reportedly died from COVID in May), is 40,130. This equates to an average of 1,295 deaths per day. The seven day rolling average number of deaths per day at the start of the month was 1,852, while today that rolling average has dropped to 1,015 deaths per day. It is difficult not to conclude based on these numbers, that the crisis is abating.
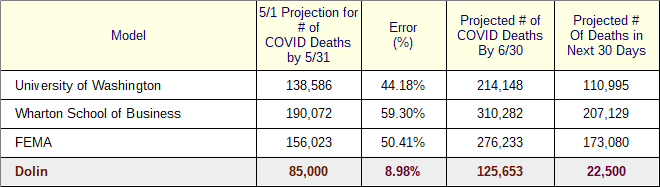
As the table indicates, the much touted University of Washington (UW), model predicted that 138,586 people would die from COVID by the end of May, and that number would climb to 214,148 by the end of June. The University of Pennsylvania (Penn), Wharton School of Business, projected 190,072 people would die from COVID by the end of May and that number would climb to 310,282 by the end of June. The federal model from FEMA projected 156,023 people would die from COVID by the end of May, and that number would climb to 276,233 by the end of June.
All three of these often cited models over-projected the COVID death counts for May. The error rate for each model, adjusted for CDC over counting, varies widely. Of the three major models, the UW performed best with a 44% error rate, followed by the FEMA model, and then the Wharton model. What’s disconcerting is how these models project into June. The UW model projects 110,995 COVID deaths in June, while the FEMA projects 173,080, and the Wharton model projects 207,129. All three of these highly referenced models predict a significantly worsening crisis in June, even though current data indicates the crisis is abating. You can be assured the media and certain state governors will continue to reference these models because they comport to their narrative even though they don’t align with the actual crisis.
My model, which no one in the media will consider even though it has consistently been spot on, had an error rate of 8.98% in May and projects that only 22,500 people will die from COVID in June. This is between 5 and 9 times lower than the federal and academic models. It continues to amaze me that these prestigious institutions with their large teams of experts, vast access to resources, and high-powered computers can so consistently be so wrong while remaining the go-to government and media sources of truth.
It’s equally amazing how one engineer on a three-hundred dollar computer using a public domain spreadsheet, can consistently outperform the experts while being totally ignored by the government and media even though I constantly share the results of my analyzes. I have been spot on with every projection since this crisis began while the “experts” repeatedly missed the mark by factors of ten. It truly is a David versus Goliath story, a Hollywood script that practically writes itself.

Comments
Comments are closed.