For other COVID posts, visit my Quarantine blog.
Many liberal state governors have decided to not fully lift lockdown restrictions until either a vaccine is found or herd immunity is reached. The political irrationality of this is two fold; 1) you prolong reaching herd immunity by quarantining a healthy population and 2) vaccines for coronaviruses don’t work so there will never be a COVID vaccine; although I predict a placebo vaccine is about to arrive at warp speed.
This country needs more engineers in leadership. Unlike politicians who live in a world where one misstep or miscalculation haunts them forever, engineers epitomize trial by error; they try one thing and if it’s not working try something else. Politicians live in constant fear of every possible outcome and base decisions not on what’s best but what minimizes negative outcomes; and those two decision trees are distinctly different. Engineers don’t worry about possible outcomes in their dogged pursuit of achieving optimal results.
That’s not to suggest engineers don’t suffer their share of fools and idiots, look at the Ford Edsel, the Challenger Space Shuttle, the Fukushima nuclear disaster, and the Tacoma Narrows Bridge, all epic engineering failures. But unlike politicians, engineers and never stop seeking to improve on things, even things that already work.
The COVID crisis quit being medical a long time ago and is now political. The governors of New York, New Jersey, California, Illinois, Michigan, and New Mexico intend to stick by their early COVID decisions to shut down economies and lockdown healthy populations regardless of negative impacts or how conditions change. Meanwhile, free states such as South Dakota, North Dakota, Iowa, Wyoming and Utah, never shut down their economies or locked down their citizens, and they’re nearly back to normal.
What distinctions can be drawn between free states and lockdown states, other than the obvious that free states have Republican governors and lockdown states are run by Democratic governors? Did you know the death count in free states is lower than in lockdown states, even after normalizing for population differences? Free states plan to open their schools this fall while lockdown states are suggesting they may not open until next year. Lockdown states intend to impose some form of mandated quarantine into the foreseeable future while free states leave the option to quarantine up to individuals.
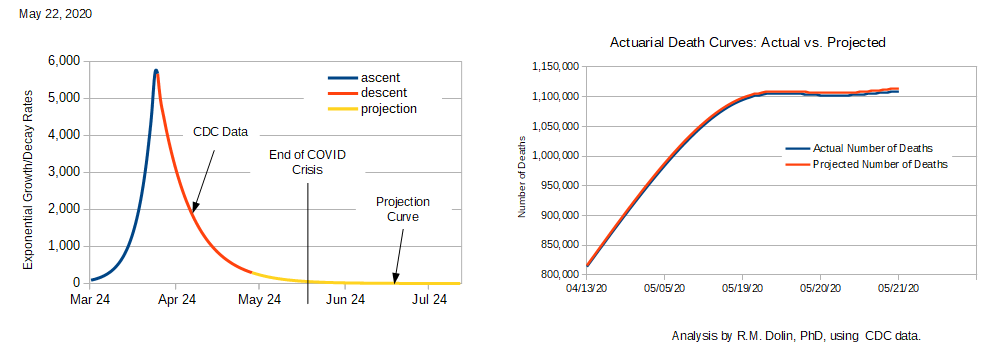
While leaders of lockdown states won’t fully reopen even though evidence shows the crisis has abated (see plot above), because that’s the decision their political futures hinge on, can we say they same about free state governors? Is their decision to return to normal biased by their initial decision not to lockdown? Is it not the same political preservation policy playing out from two extremes? Perhaps, but let’s delve deeper before we decide.
Lockdown state citizens tend to be liberal, which is why they have Democratic governors. They tend to have a high ratio of permanently unemployed, homeless, and people living below the poverty line. Lockdown states tend to have a large disparity between the upper echelon of their society in terms of education and wealth and the lower echelons. Citizens of lockdown states also tend to have a greater reliance on government to help manage their lives. While saying these things may seem controversial, it is simply a statement of fact.
Free state citizens tend to have a smaller disparity between upper and lower echelon segments of society. They tend to have lower rates of unemployment, homelessness, and people living below the poverty line. Free state citizens also have lower crime, fewer drug overdoses, and less obesity. Citizens of free states tend to have a greater sense of self-reliance, self-determination, and tend to resist most forms of government intrusion into their lives.
So perhaps it is fair to conclude that the governors in both the lockdown and free states are basing their political COVID decisions on the demographics of their citizens, which is something we should all be able to agree is how our republic is supposed to function; by the will of the governed. So perhaps the takeaway from this short social studies exercise is that people in lockdown states should quite complaining, you got the government you chose. Likewise, people fortunate enough to live in a free state should be grateful that you too got the government you chose.
Note: I am introducing a new chart today based on actuarial tables that show the number of Americans who have died from something thus far this year relative to the number of people who were projected to die. These plots are based on highly respected and refined actuarial tables (used by the insurance industry) and as you can see, are quite accurate. Someone wrote me recently saying that talk show host Michael Savage discussed my work using these tables as credible. What’s significant is that the projected death curve was developed preCOVID, notice how even during the pandemic actual deaths (including COVID) matched the preCOVID projections. Is this just an amazing coincidence or is something fowl afoot?
The other plot shows the CDC data for the exponential rate of change in the number of COVID deaths in the U.S. The yellow curve is my projection of future decline. My model shows the crisis is over in early June while the highly promoted but consistently wrong University of Washington model shows the crisis is not over until August. We’ll find out who’s more right in three weeks.
