
To see other COVID posts, visit my Quarantine blog.
Remember those talent challenged guys from the University of Washington who have the pandemic model the media absolutely loves? You remember, the guys who in February predicted 2.2 million would die by the end of summer, and then in March revised their estimate to 250,000 would die by April 14th, and then in April re-revised their revision to 65,000 would die by July. Well that same crew is back with their highly anticipated May monthly projection, only this time, after repeatedly embarrassing themselves and all of academia, they’re presenting an estimate so devoid of meaning it’s clear that even they no longer believe their model.
The media is again hyping the latest University of Washington projection that by August 4th, there will be between 95,000 and 243,000 Americans dead from COVID. With such a wide gap, the model is devoid of sufficient fidelity to be useful for anything other than parody. Meanwhile, President Trump offers a somewhat more specific projection that between 75,000 and 100,000 will die.
If you’ve been following this COVID log, you’ll recall that in early April we used a first principles approach to vet the federal and academic model projections and while we were essentially spot on with our April 14th projection, the sophisticated federal and academic models were off by an amazingly erroneous factor of ten. Now these same folks are back making more projections, only with a new twist. Now they’ve added a lower bound that most believe will be surpassed along with an upper bound that scares the hell out of you. But before we get to high on our soap box, lets repeat our previous first principles analyzes and see where we stand.
Before we get started, here are some provisos;
- I will approach this problem from multiple angles using the same data with different assumptions. I’ll try to keep things as straight forward as possible but buckle up for a wild ride.
- While I often belittle the federal and academic projections, this is not a competition. Rather, it is an expression of frustration on my part that there seems to be so little understanding by federal and academic prognosticators about the implications of their projections and their lack of professional standards.
- Even though we treat this problem in the abstract, we must remain cognizant of the fact we are talking about American lives. That being said, getting to the truth is important and the only way to do that is to remove emotion from our calculus by abstraction.
We begin by listing our knowns
- According to the CDC,
- the first U.S. COVID death occurred on February 29th,
- There have been 1,180,634 confirmed COVID cases to date
- There have been 68,934 COVID deaths to date
- The percent of population confirmed infected is 0.369%
- The percent of confirmed infected who have died is 5.84%
- The percent of Americans tested for COVID is 1.62%
- 2,507,500 Americans die each year from something, ~7,500/day
- Herd immunity is achieved when 60% of the population becomes infected and the virus dies for lack of new hosts.
- The Population of the U. S. is 328,200,000
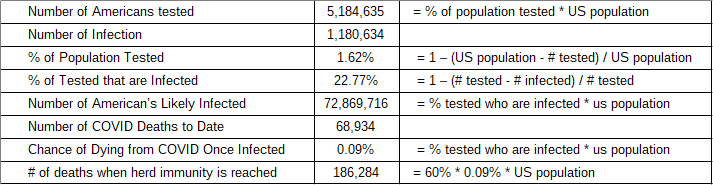
Model 1: Assume CDC Data Is Correct
Given that 1.62% of the population has been tested and 1,180,634 cases were confirmed, then by extension, if the entire population were tested there would be 72,869,716 actual confirmed cases or 22.77% of the population. If 72M Americans are actually infected, it means the chance of dying once infected is 0.09% and the projected number of deaths when herd immunity is reached would be 186,284, which is above the upper estimates of both the U of W and the President’s projections.
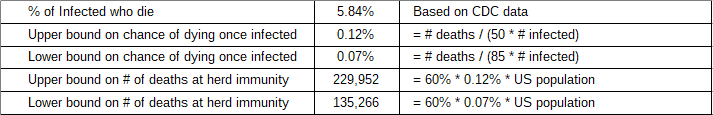
Model 2: Assume the Results of the Stanford Study
A fallacy in the first model’s logic is that the 5.2M Americans who have been tested for COVID were not selected at random. It is likely that those tested had reason to suspect they had COVID which skews the statistics toward a higher projection. Some researchers estimate that a far higher percentage of the population has been exposed to the virus. According to a Stanford University study, if a random sample of the population were tested the results would be 50 to 85 times more infections than the CDC confirms. If that were the basis for estimate, then between 230k and 135k deaths would occur by the time we reached herd immunity, which is close to the UofW projections and bounds the President’s projections. Note: the Stanford study was based the published CDC statistics.
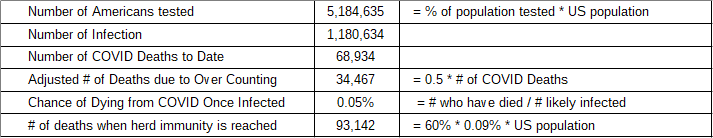
Model 3: Assume the CDC Over Counts the Number of COVID Deaths
There has been a lot of published material pointing out that the CDC has a history of sensationalizing data. On top of that, the US government pays doctors and hospitals $39K each time they attribute a cause of death to COVID, which skews the data toward more sever outcomes. Several states (e.g., New York and Pennsylvania) have admitted to inflating their COVID deaths by over 50%. If we project the number of deaths when herd immunity is reached based on the number of people likely to be infected relative to half the CDC count for the number of COVID deaths, then we arrive at a projection of 93,142 deaths when herd immunity is reached. This estimate is below both the UofW and the President’s projections.
Model 4: An Actuarial Assessment
As you are starting to see, there are a lot of ways to arrive at a projection. However, one that I have not seen anyone else do yet is an actuarial approach. Perhaps the only way to estimate the true number of COVID deaths is to first compute the number of deaths that were expected to occur this year due to something using actuarial tables and subtract the number of deaths that have occurred. The delta should be the increase in deaths caused by COVID. This is a controversial approach because it gets into the morass of suggesting that people who die from COVID were going to die from something else. Let’s not go there, but still see where an actuarial analysis takes us.
Approximately 2,507,500 Americans die each year from something, which means that year to date 988,620 Americans were expected to die. So far in 2020, 984,462 Americans have died, which means (and this is where the ice starts to thin), fewer Americans have died so far this year than would be expected in a normal nonCOVID year.
Another way to phrase this conclusion is that the impact of COVID (e.g., shutting down the economy and quarantine) has actually reduced the overall number of US deaths. Another highly controversially conclusion would suggest that all the deaths attributed to COVID would have been from something else. While that’s not really true, there is some correlation. It will be interesting to see if this trend continues. Note: this analysis assumes that the projected actuarial death rate is linear, i.e., constant throughout the year. While that is probably not true, it is also probably not too far off. This result cannot be used to assess the accuracy of federal and academic models because it presumes an entirely different approach. It is however valid to use this analysis when assessing the overall impact of COVID on the number of U.S. deaths relative to a normal year. In that framework, this analysis is astounding.

Model 5: An Exponential Growth Analysis
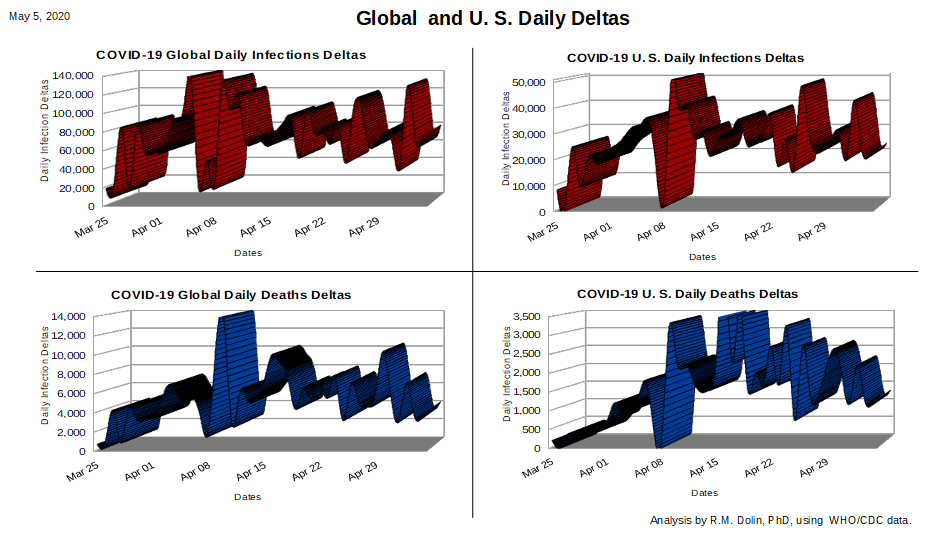
If you recall from posts back in early April, we used the simple exponential function, f(x) = a^x, to perform a first principles analysis that accurately predicted the COVID death count on the federal government’s mythical apex day of April 14th. We can again turn to this approach to derive an estimate of the number of COVID deaths at the point when herd immunity is reached but its a bit of a complicated process. First, we have to use the plots at the top of this post to estimate when we think the apex in death rates occurred. From there we can use CDC data to develop the exponential curve that models the ascent up to the apex.
In order to develop an exponential curve to estimate the descent down to herd immunity, we have to determine a date when herd immunity will be achieved. Once that is done we can generate the curve and after that we can integrate the two halves to find the area under the curve, which will be the number of deaths at herd immunity. We begin with an assessment of the two plots above representing the U.S. infection and death deltas.
I’ve decided to save this for another day when I can dive into things in more detail. Kind of anticlimactic I know, especially since of the five models presented, my belief all along is that this will be the model with the greatest fidelity.
Summary
The federal and academic models have not once come close to accurately projecting the behavior of the COVID crisis, in fact they have consistently been wildly wrong, and yet the media hypes the academic models as if the virus is compelled to follow it. The latest revision of the re-revised University of Washington model puts the COVID death count on August 4th at between 95k and 243k. Meanwhile, President Trump puts the range between 75k and 100k.
We performed four first principle analyzes having the following results
- Assume the CDC data is correct. Result: project 186 deaths by herd immunity.
- Assume the Stanford University study. Result: between 135k and 230k deaths by herd immunity.
- Assume the CDC over-counts COVID deaths. Result: 93k deaths by herd immunity.
- Actuarial Assessment. Results: The number of deaths so far this year due to all causes are 4k less than expected.
All the first principle analyzes are essentially within the University of Washington’s projected upper and lower bounds. Meanwhile, the only analysis within President Trump’s projection is the one that assumes the CDC over counts. Let’s all hope President Trump is right.
