
To see more Quarantine posts, visit my quarantine page
On April 1st, experts utilizing federal and academic pandemic models made two predictions;
- That the virus would reach it’s apex on April 14th
- That the U.S. death total on that date would be 250,000.
Today is the dire day of the mythical apex and we can now look back with postmortem clairvoyance to assess how well their projections matched reality.
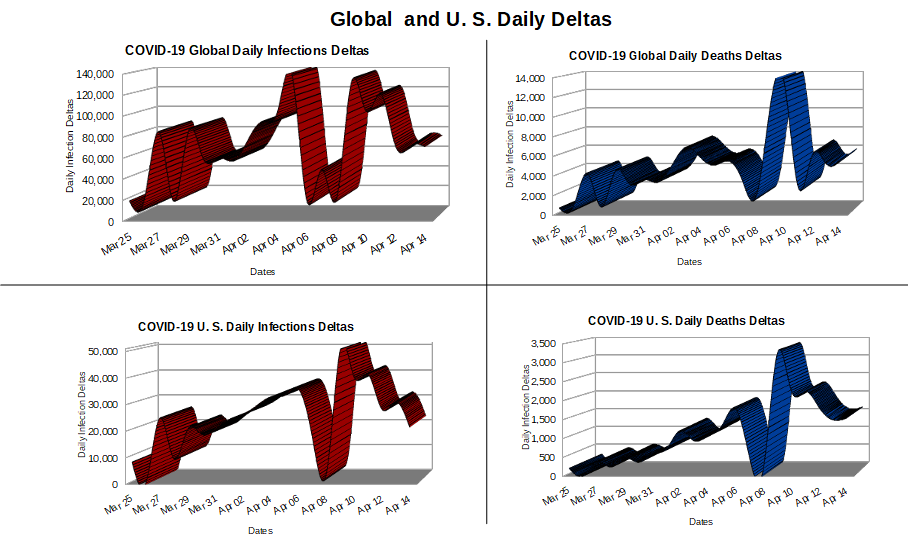
But before we do, we need to discuss the above graphs, which represent global and national daily infection and death totals. I caution you not to get too caught up in how the charts behave from day to day. The WHO/CDC have an enormous task compiling daily totals and one day’s data may arrive too late and have to be put into the following day’s totals, and so forth. What’s important are the general trends. I could have used regression to smooth out these curves, but felt it better to present the WHO/CDC data as reported.
Infection Rates: The two plots on the left represent the global and U. S. daily infection totals. Notice how they generally mirror each other. While the global chart seems to be bi-modal (having two peaks), it’s probably more of a plateau with reporting inconsistencies (as cautioned above). The dip on April 8th, in U. S. infection reporting is also probably a reporting anomaly. The important take away from these charts is that the virus infection rates seem to have reached their apex around April 10th and it occurred both globally and nationally at the same time. From April 10th, the infection rates have steadily declined. Federal and academic models predicted the apex would be on April 14th, so they missed it by 4 days; not bad for a bunch of cyber-geeks under enormous pressure.
We should all try to appreciate experts being reticent about claiming the apex has been reached, it’s prudent to wait and see if what appears to be an apex is really just a dip. I believe the charts provide ample evidence that even with understandable reporting inconsistencies, the apex has been reached and infections are on the decline.
Death Rates: The two charts on the right, represent the global and U. S. daily death totals. Notice how they also generally mirror each other. This can in some sense be attributed to the U. S. experiencing the highest death rates in the world now. That being said, the U.S. only represents 5% of the world population so how much could it really influence global charts?
Notice the U. S. death tallies align with global death tallies, and that both peaked on April 10th. We are constantly being told that there is a lag between infections and deaths, which intuitively makes sense. However, that phenomena does not appear to be born out by the data. If there was a lag, the infection apexes would occur before the death apexes and they don’t. The steep decline in the global death tallies post apex before a sharp rise probably has more to do with reporting lag. In general the global death rates seem to be on a steady decline similar to the U. S. decline. While trends can always shift sharply upward if conditions change, overall this is good news.
Summary: Federal and academic models projected the COVID apex for infections and deaths would occur on April 14th, but WHO/CDC data indicates the apex actually occurred on April 10th. Federal and academic models projected that by April 14th, the U. S. would realize 250,000 deaths, when in fact 23,650 deaths have occurred thus far. This means the federal and academic models were off by a factor of 10, which borders on useless or akin to blindly throwing darts at a wall. Recall that we projected 30,500, so we were only off by a factor of 1.29, which is pretty good for a bunch of stay at home quarantiners using a high school math formula for a model.
The questions for we as a Nation and we as a world going forward are,
- Will governments acknowledge the virus is in decline and both reopen the economy and end over-reach edicts?
- Will the world and the nation do a proper postmortem, which has to begin with the CDC acknowledging that they’ve over-reported the U. S. virus death count by treating all deaths as COVID related (e.g., no flu deaths in the U. S. this year)?

Like!! I blog quite often and I genuinely thank you for your information. The article has truly peaked my interest.