
For the past two weeks we’ve been using data put out by the World Health Organization and the Centers for Disease Control to chart not only how the COVID virus has spread, but also to understand projections being made by federal and academic models. Utilizing a simple exponential growth formula, we demonstrated estimates being inferred by federal and academic models do not seem to align with actual COVID data.
Years ago I had the opportunity to participate in an intensive two-year Six Sigma training academy at Bechtel, the worlds largest and most smartly run engineering company. One of the first things they taught us was that to be a successful change agent you had to, “talk truth to power,” and the way to do that is through data and going where analysis of data takes you; even when contrary to popular perceptions. For two weeks now Americans have been inundated with sensational governmental and academic claims about the number of anticipated COVID deaths on the mystical apex day of April 14th, while our analysis has led to a different conclusion.
Our argument has relied on simple mathematical constructs and exclusively on past performance data. We’ve been upfront acknowledging federal and academic models rely on more sophisticated mathematical formulations and incorporate additional informational clairvoyance we’re not privy to. In other words, their models should be of higher accuracy and fidelity. That being said, data is as data does and you can’t out maneuver data with gee whiz mathematics and powerful persuasion.
Today we reassess the data from a fresh perspective to see if we either validate federal and academic projections or further vindicate our assertions. To do this however, we’ll have to dip our toes into the deep end of the pool. I recognize that my fellow Los Alamos PhDs and Bechtel Black Belts will have no trouble following my logic, but I’m not writing this for you. Rather, I’m presenting this for the teenage girl who commented yesterday on how cool she thought our breakdown of the virus data has been and wondered what she could study in college to learn how to do stuff like this. While she could of course study math, I’ve never met an interesting mathematician so I told her if she wanted a life of adventure surrounded by interesting people doing exciting stuff she should study engineering.
The folks in academia should be able to follow our approach, but probably the only person in media who can keep up is Michael Savage, who has a PhD in epidemiology and like me, studied at UC Berkeley. For the rest of you, I apologize in advance if things get wonky, I’ll strive to prevent that from happening.
Our exploration will determine whether or not federal and academic models that project upwards of 250,000 US deaths from COVID by April 14th are realistic. To recap, recall our simple mathematical model based on exponential growth; namely,
f(x) = a^x,
which reads as “the function f(x), equals the base number a, raised to the x power.”
When doctors Fauci and Brix projected on April 1st that by April 14th the US would realize 250,000 deaths, we utilized our simple mathematical formula to derive the value that base number a, had to be in order for the Fauci/Brix projection to be valid and found that, a=2.43. Combined with a value for x of x=14, which was determined based on the 14 days between April 1st and April 14th, this gave us,
f(x) = a^x = 2.43^14 = 250,316.
A few days later while still trying to make sense of the Fauci/Brix model, we showed that if their value for variable a were reduced 11% to a=2.165 then f(x) is reduced to f(x) = 49,706, which we asserted though existing data, would be the projected number of US deaths by April 14th if the US experienced a scenario similar to Italy. We then discussed how future values for variable a can never be known with certainty but that data can be used to precisely calculate previous values.
Based on those prior discussions, we’re now ready to determine what the daily values for variable a would have to have been each day between March 24th and April 7th in order for f(x) to equal published values for the number of COVID deaths on each day. The basis for the value of variable x, in our equation f(x) = a^x, is that the first US COVID fatality occurred on February 29th. So for example, if we calculate what the value of variable a, was on April 7th, then x=39, since April 7th is 39 days after February 29th.
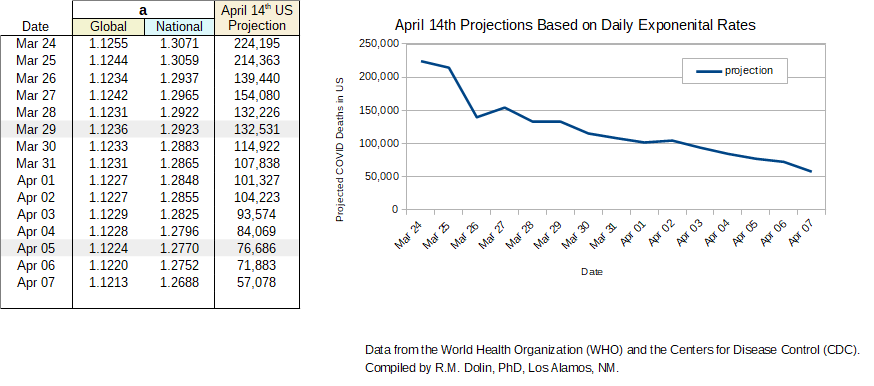
The table above shows both the global and national values required for variable a, from March 24th to April 7th, for f(x) to match the number of respective COVID deaths on each of those days. The right most column contains a projection for what the number of US deaths would be on April 14th if variable a, on each date continued until April 14th. For these calculations, the variable x=46, since there are 46 days between February 29th and April 14th.
Before discussing those projections though, lets look at what the global and national values of variable a, from March 24th until April 7th indicate. First, notice in the above table that the global values for variable a, are constant to two decimal places for all dates. This suggests that the global death rate, at least for now, has achieved steady state. This is a vastly different conclusion than ones being touted by federal, academic, and international models. If that weren’t disconcerting enough, when we look at the national values for variable a, not only are they not trajecting upward in an exponential manner as federal and academic models assert they should, they’ve been trending steadily downward since March 24th. This finding is diametrically opposite of what federal and academic models contend and what powerful people in government and media expound. FYI, this is where truth to power requires fortitude.
The right most column in the table above projects the number of COVID deaths in the US by April 14th, if we applied our equation f(x) = a^x on that date using that day’s values for variable a, and x extended out to April 14th. For example, if the value a = 1.3071 on March 24th were used on March 24th to project the number of COVID deaths in the US by April 14th, the estimate would be
f(x) = a^x = 1.3071^46 = 224,195.
Similarly, if the March 29th, value of a = 1.2923 were applied on March 29th to estimate the number of COVID deaths in the US by April 14th, the result would be
f(x) = a^x = 1.2923^46 = 132,531.
Likewise, if the most recent value from April 7th, of a = 1.2688 is used to estimate the number of COVID deaths in the US by April 14th,
f(x) = a^x = 1.2688^46 = 57,078.
Do you feel the drama and excitement building from these three examples as we near our exciting conclusion? Let’s raise the curtain and let Carol Merrill tell us what’s behind door number three; namely that this final estimate for f(x) is quickly approaching the number we first projected seven days ago.
To date, there have been 10,781 COVID deaths in the US. Federal and academic models project that the number will climb to 250,000 by April 14th, while our simple model suggests that based on current virus performance, the number is more likely to be around 50,000. The results of the above analysis seem to invalidate federal and academic projections while at the same time validating the projections we first made on April 1st.
As verification that our observation highlighted in the plot above concerning the downward trend in variable a, is correct, the University of Washington today revised their model projections downward from 200,000 to 80,000. I applaud UW for their willingness to reconsider evidence. While your model is converging toward what the data indicates, you’re not there yet. The federal model has yet to be revised downward, but smatterings of official backtracking suggests they know it should be. The question is can government bring itself to admit the fallacy of earlier sensationalism? I predict that in the coming days their models will be revised downward along side claims regarding their prowess in enacting mitigation measures. But then again, in politics pride truly does goeth before the fall.
To conclude, today’s analysis of COVID-19 data continues to assert that we’ve been right from the start. Thanks for sticking with me through this morass of mathematics, I apologize if along our journey to this very interesting conclusion things got a bit convoluted. I encourage you at your leisure to study the table and plot above, hopefully then the logic we employed will make better sense.
Note: While the trend over the past two weeks in the rate of growth of COVID deaths in the US has been downward, the US can still experience an upward trajectory, i.e., we’re not out of the woods yet. As I have repeatedly stated, we don’t have access to the informational clairvoyance federal models use, so our analysis relies exclusively on past performance. But, as Aldous Huxley noted, “facts do not cease to exist because they are ignored.”
